Choosing between hydrolyzed bovine collagen manufacturers often feels like comparing identical boxes—same protein percentage, similar average molecular weight, and overlapping health claims. Yet in reality, two powders that look alike on a certificate of analysis can perform so differently that one becomes a bestseller and the other piles up customer complaints. The gap is not magic; it hides in six specific measurements that every COA should disclose. This article translates each number into plain terms, explains why it matters for a final product, and gives clear thresholds that separate premium collagen from commodity powder.
| What to Measure | Target Number | Why It’s a Deal‑Breaker or a Green Light |
|---|---|---|
| Hydroxyproline | ≥ 11.5% | Proves the powder is real collagen, not diluted with cheap vegetable filler. |
| Bloom (gel strength) | 0 g | Confirms full hydrolysis; otherwise the drink clouds up or turns to jelly. |
| Ash | ≤ 1.0% | Keeps taste clean and prevents chalky sediment at the bottom of a glass. |
| Whiteness (L‑value) | ≥ 90 | Guarantees a bright white appearance that consumers associate with purity. |
| Molecular spread (PDI) | ≤ 1.5 | Indicates tight size control; avoids the “mixed bag” of tiny and huge peptides. |
| Turbidity (5 % solution) | ≤ 15 NTU | Tells you whether the drink will be crystal clear or look like cloudy milk. |
The six figures above form a practical checklist that anyone in procurement, R&D, or quality assurance can use immediately. The following sections walk through each one, not as a data dump but as a narrative about what happens inside a bag of collagen powder and how those processes show up in the lab.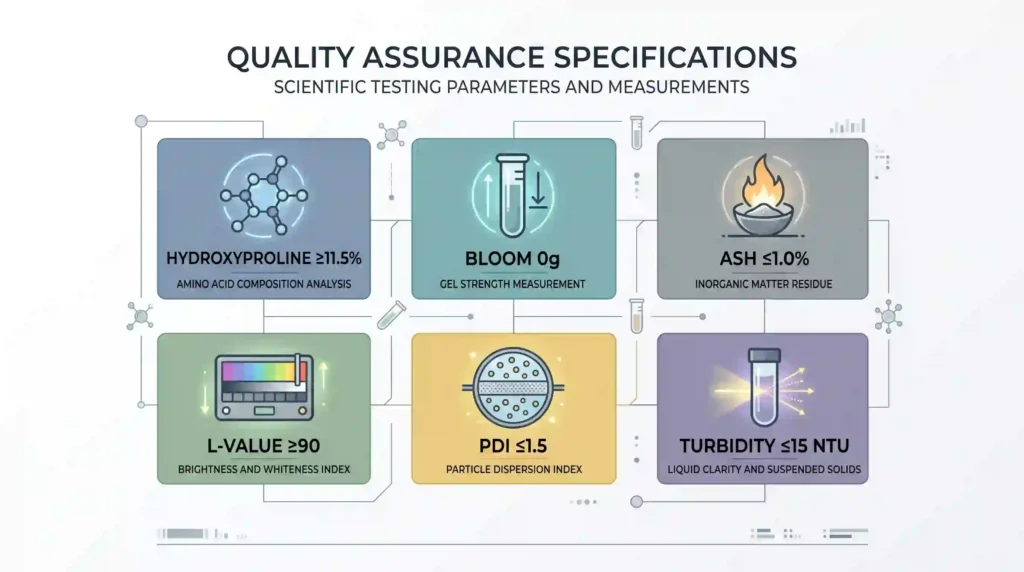
Hydroxyproline: The Chemical Signature That Cannot Be Faked
Collagen is almost the only protein in nature that contains hydroxyproline at meaningful levels. Soy, wheat, and pea all completely lack this amino acid. So when a lab measures hydroxyproline according to AOAC method 990.26, it directly counts how much of the powder is actually collagen. A genuine Type 1 and Type 3 bovine collagen lands somewhere between 11.5% and 12.5% hydroxyproline by weight. Think of it as a built‑in purity meter: if the number dips below 10%, at least one‑tenth of the powder is something other than collagen.
In practice, a low hydroxyproline reading often means a manufacturer has cut the product with cheaper proteins to reduce cost. It could also signal poor raw‑material handling, where different protein streams get mixed unintentionally. Either way, the result is the same—a product that cannot legally or honestly be called pure collagen. The best hydrolyzed bovine collagen manufacturers test every batch and deliver the result alongside a lab accreditation certificate. A buyer who sees 11.8% on three consecutive shipments knows the supply chain is tightly controlled; a buyer who sees 9.2% on one shipment and 11.9% on another should ask for the full amino‑acid profile before signing off.
Requesting the hydroxyproline value is not a special favor—it belongs on every professional COA. If a supplier hesitates or says the number is only “typical,” that hesitation itself is a red flag worth more than any brochure.
Bloom: Why a Number Created for Gelatin Is Vital for Collagen
The Bloom test was originally designed to measure the firmness of a gelatin gel. A high‑Bloom gelatin gives a wobbly dessert; a low‑Bloom one makes a softer confectionery. For hydrolyzed collagen, the desired Bloom number is simple: zero. That is because hydrolysis chops the long protein chains into small peptides that cannot tangle into a gel network. When a powder still shows even 5 g of Bloom, some gel‑forming chains remain, which means the hydrolysis step was cut short.
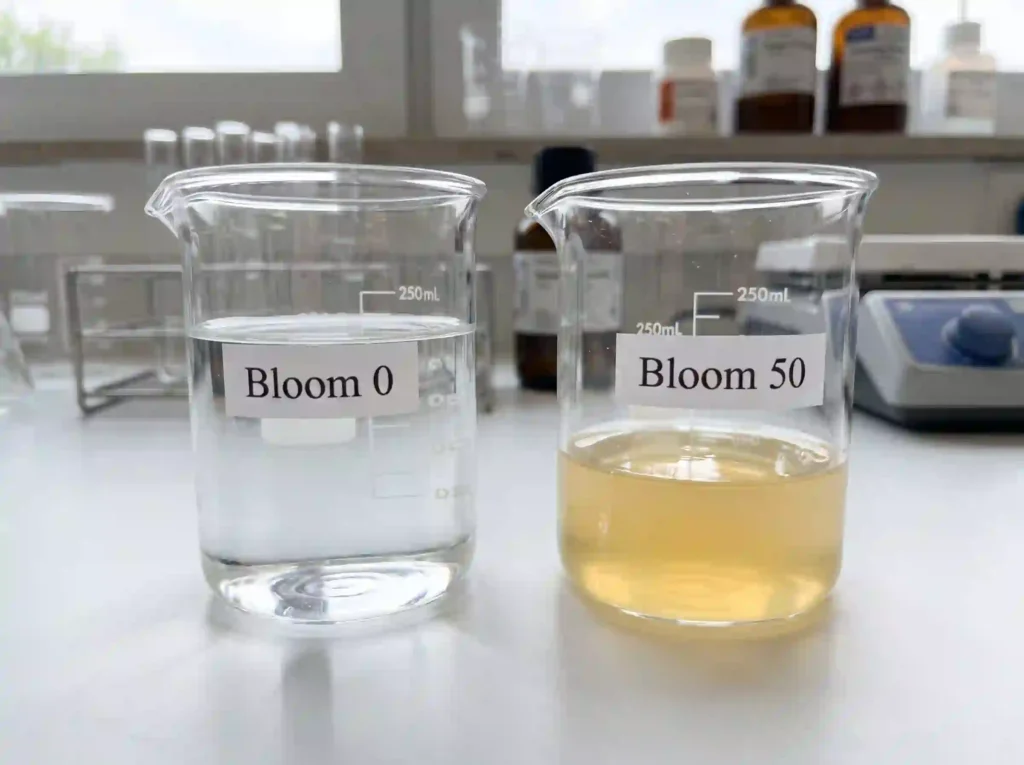
The consequences of a non‑zero Bloom are easy to see. Dissolve the powder in cold water and refrigerate it for a few hours. A true zero‑Bloom collagen stays completely liquid and clear. A 5‑Bloom product develops a thin, gelatinous skin on the surface and a faint haze. A 10‑Bloom product visibly turns into a soft jelly—perfectly fine for a gelatin supplement but disastrous for a ready‑to‑drink beauty beverage that is supposed to be refreshing and transparent.
Because the Bloom test is quick and standardized (USP ‹854›), there is no technical reason for a manufacturer not to supply it. The most consistent hydrolyzed bovine collagen manufacturers log Bloom on every batch and see zero as the default, not the exception. A single batch with 2 g of Bloom can slip through, but if the number bounces between 0 and 6 across shipments, the hydrolysis tanks are not under statistical control.
Ash: The Mineral Residue That Affects Taste and Looks
Raw bovine hides carry natural minerals. The demineralization step inside the factory uses water and acid to wash these out. Ash is what remains when the finished powder is burned at 550 °C—mostly calcium, phosphorus, and trace metals that were not washed away. A low ash content (1.0% or less) keeps the collagen tasting neutral and prevents little grey specks from drifting to the bottom of a clear bottle after a few days on the shelf. A high ash content, above 1.5%, usually brings a faint chalky or metallic aftertaste and visible sediment that no amount of shaking can permanently hide.
For a flavored smoothie or an opaque protein bar, a slightly elevated ash might still be acceptable because the recipe itself masks minor off‑notes. But for unflavored collagen water, beauty shots, or any transparent packaging, the target should stay firmly at or below 1.0%. When evaluating a supplier, asking for a twelve‑month ash trend chart is more informative than reading a single “average” value. A steady line between 0.8% and 1.0% indicates a mature process; a saw‑tooth pattern between 0.7% and 2.1% suggests that the demineralization step runs on autopilot without enough oversight.
Whiteness: The L‑Value That Consumers Interpret as Freshness
Human beings make split‑second judgments about color. A brilliantly white powder signals purity, freshness, and high manufacturing standards. A yellowish or greyish powder triggers the opposite impression—even if it is chemically safe. The CIE LAB scale measures whiteness with the L‑value, where 100 is a perfect white surface and 0 is black. Commercial hydrolyzed bovine collagen should consistently read at least 90; top performers reach 93 and above.
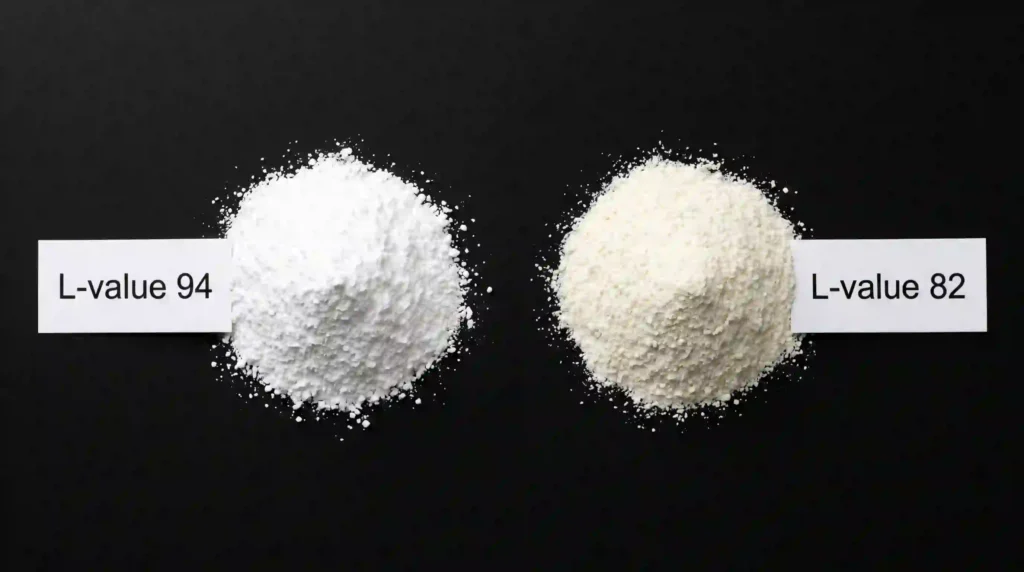
Discoloration creeps in from several sources: traces of blood or pigment in the raw hides, excessive heating during spray drying that caramelises leftover sugars, or insufficient filtration. The whiteness parameter matters most for companies that package their collagen in clear capsules, transparent stick packs, or white‑label products where visual consistency from one batch to the next is a brand promise. A manufacturer that tracks L‑value daily and ties it to dryer settings has already moved beyond guesswork and into real process control.
Molecular Weight Distribution: Beyond a Single Average Number
Almost every collagen supplier advertises an average molecular weight, usually 2000 or 2500 Da. That average is a bit like saying the average age of people in a room is 30—one room could contain a kindergarten class and a retirement home and still average 30. Similarly, a collagen powder with an average of 2000 Da might be mostly tiny peptides, or it might be a messy blend of very light and very heavy chains. The performance difference between those two powders is vast.
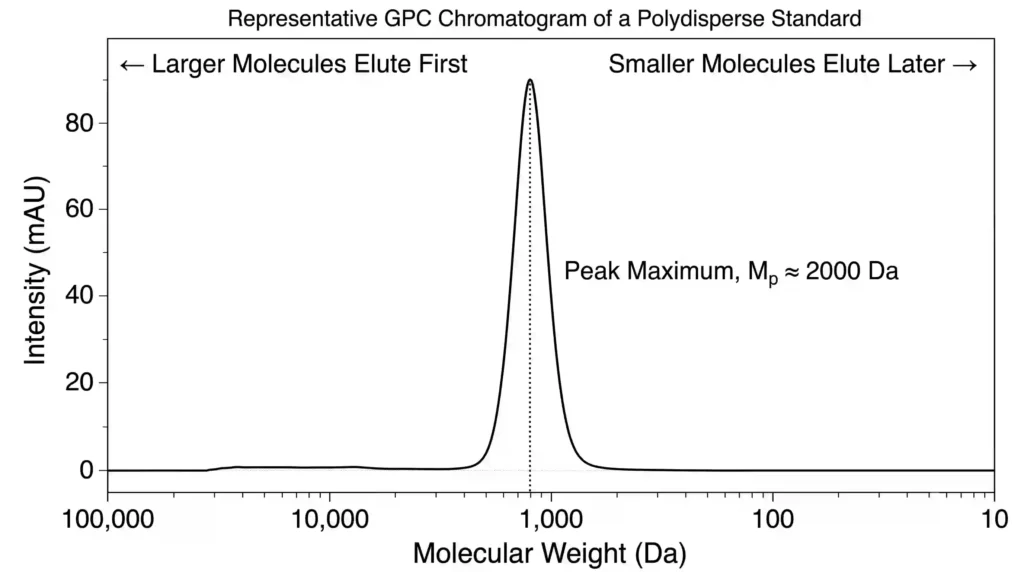
Gel permeation chromatography (GPC) untangles this puzzle. It produces a curve showing how much of the powder falls into each molecular weight bucket. Three numbers from that curve are worth memorising. First, the polydispersity index (PDI), which compares the average chain size to the spread. A PDI of 1.5 or below means the chains are tightly clustered; above 2.0 means the distribution is wide and unpredictable. Second, the fraction below 2000 Da should exceed 80%—that is the sweet spot for instant solubility and negligible light scatter. Third, the fraction above 10 000 Da should be below 1%. Those long chains are the main culprit behind turbidity, gelling, and mouthfeel complaints.
Hydrolyzed bovine collagen manufacturers who actually run their own enzyme reactors almost always run GPC as a matter of routine. Those who buy bulk powder and repackage it often cannot. Asking for the full chromatogram—not just the calculated average—is a remarkably efficient way to identify the true manufacturer behind a seller.
Turbidity: The One‑Minute Bench Test That Every Formulator Loves
If a formulator could measure only one parameter, turbidity would have the strongest claim. The test is simple: dissolve 5 g of collagen in 100 mL of pure water at room temperature, stir for a minute, and point a calibrated nephelometer at the liquid. The result, in Nephelometric Turbidity Units (NTU), captures in a single number whether the powder was properly hydrolysed, filtered, and dried. Below 10 NTU, the solution looks like tap water. Between 10 and 15 NTU, it shows a tiny shimmer but still reads as clear to most consumers. Above 30 NTU, the drink turns milky and starts to sediment.
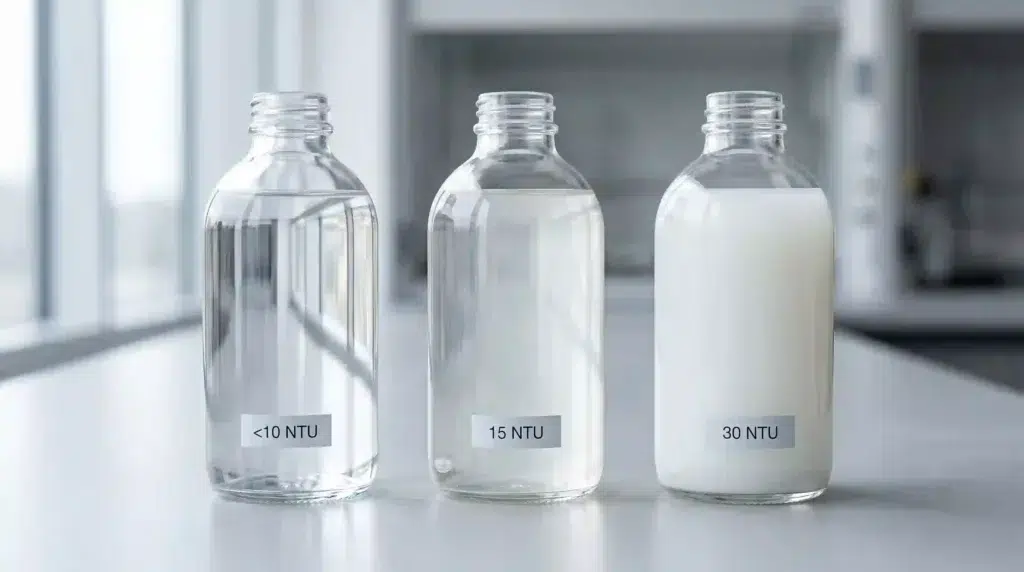
Because turbidity integrates so many upstream factors, a jump from 8 to 19 NTU between batches is a clear signal that something changed—an enzyme lot, a water softener recharge cycle, a spray‑dryer temperature excursion. Mature manufacturers investigate such shifts and document the root cause. Buyers who track turbidity across the first three or four deliveries build a baseline that makes later deviations stand out immediately.
Safety Docs: The Benchmark Set Nobody Should Skip
Performance metrics are valuable only when the powder is safe to eat. Every shipment from a qualified manufacturer should come with a heavy‑metal panel showing lead, arsenic, cadmium, and mercury all below 0.5 ppm (with cadmium and mercury ideally below 0.1 ppm). The microbiology section needs total aerobic count under 10 000 cfu/g, yeast and mould under 100 cfu/g, and an absence of salmonella and Escherichia coli. BSE/TSE safety is an extra layer: a certificate of origin that confirms the hides came from a negligible‑risk region and that the entire chain was inspected for human consumption. Without this paperwork, even a perfect‑tasting powder can be held at the border.
Turning the Six Numbers into a Decision
Collecting all six values—hydroxyproline, Bloom, ash, L‑value, PDI with the fraction cutoffs, and turbidity—from two or three short‑listed suppliers instantly replaces vague marketing promises with an objective scorecard. Most procurement teams fill in a simple table with columns for each parameter. The supplier that can source the numbers and back them with GPC charts, trend logs, and accredited lab reports is almost always the one with real manufacturing depth. The supplier that replies with “we guarantee typical values” has already admitted it cannot track its own quality.
Nobody expects a new buyer to master collagen chemistry overnight. But the six numbers described above require no chemistry degree to understand—just a willingness to read the COA line by line and ask for the specific evidence behind each figure. Once that habit takes root, evaluating hydrolyzed bovine collagen manufacturers stops being a leap of faith and becomes a straightforward, data‑driven process.
At Atnutra, every lot of Type 1 & 3 hydrolyzed bovine collagen comes with these six values printed on the batch COA, supported by a GPC chromatogram, an ISO‑17025 heavy‑metal panel, and a valid BSE‑free certificate. Get a sample and the full documentation package here.